What is My Balance Sheet Trying to Tell Me?
Your financial statements are like the road maps of your business. They tell you where you’ve been, where you are and where you’re headed. Whether it’s the P&L, Cash Flow Statement, or Balance Sheet, every report you run is speaking to you, telling you something important about your business. Let’s drill into the data in the Balance Sheet to give you a better idea of what your report is saying to you.
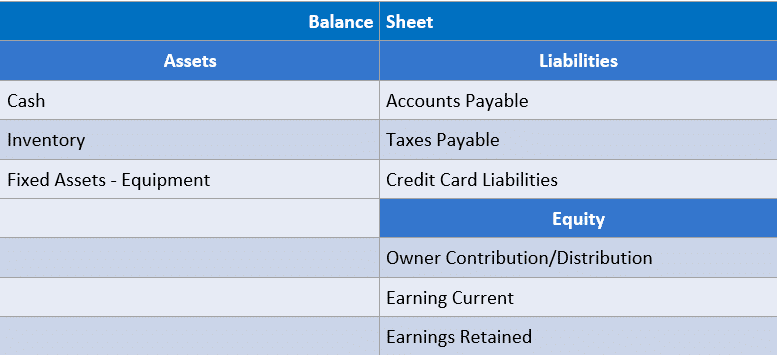
Breaking Down the Balance Sheet
Many ecommerce entrepreneurs don’t spend much time on the balance sheet. As a business owner, it is an important report to understand and monitor. Let’s start with the big picture. Author Keith J. Cunningham in The Ultimate Blueprint for an Insanely Successful Business explains the Balance Sheet is the World Atlas, while the Profit and Loss Statement and the Cash Flow Statement are Street Maps. He describes the components of the balance sheet as: the left-hand side (Assets) is for “Things and stuff” and the right-hand side (Liabilities) is for “What you owe and own.” The accountants know that the balance sheet equation is Assets = Liabilities – Equity.
Cash Accounts
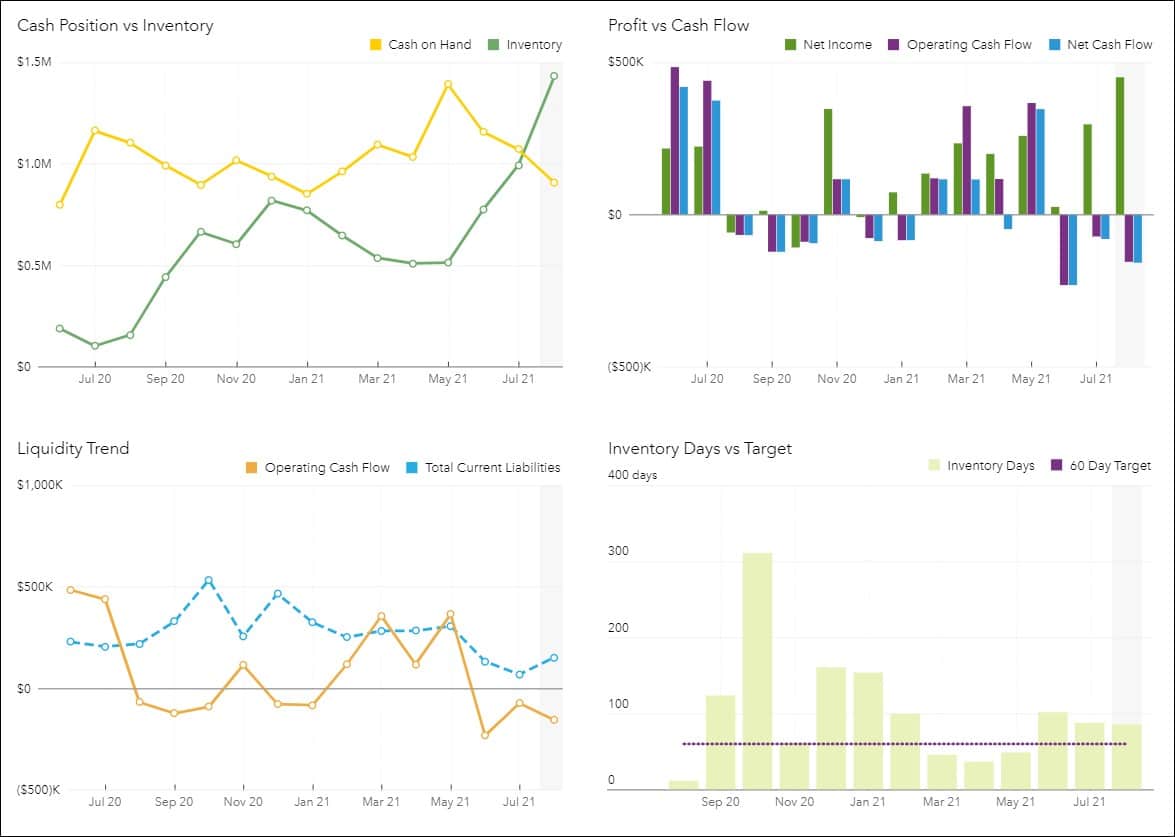
What are the main numbers on the balance sheet that you want to monitor each month? I recommend you run your balance sheet for the year to date and have it display by months. First, look at what is happening to your cash accounts. Are you growing your cash balances or are they dropping? A helpful chart to monitor this at a glance is the Cash on Hand Graph (below) that also displays high and low balances.
Your balance sheet by month will also allow you to see the trends not only with cash accounts but also your debts. Growing cash and reducing debts is a signal that you are effectively managing your assets. It should always be your goal to minimize the assets required to produce the maximum amount of revenue. The Liquidity Monitor Graph below helps you to understand the trend in the relationship between your current assets and current liabilities.
Inventory Accounts
The other important account to monitor is your inventory account balances. For ecommerce sellers, maximizing the return on inventory should be a key focus area. Is your product turning over quickly? Do you have stale inventory tying up your cash? Inventory is simply cash you can’t spend, so make sure it is being managed effectively. Ensure you have systems in place to track inventory appropriately and that you are tracking and attempting to reduce inventory days (the length of time your inventory sits on your shelf before it is sold) which subsequently increases your inventory turns.
Many of our clients are making down payments for inventory and paying balances as products ship. These products may be in transit for 60 days or more before they are available for sale. With money tied up in inventory, you want to carefully monitor those prepaid and in transit items to ensure you are making your inventory evaluations based on products in hand.
Equity Section
Finally, the Equity section of the balance sheet incorporates your past year’s cumulative performance in the retained earnings accounts. If you have made owner contributions or taken distributions from your business, that will show up in the equity section of your balance sheet. The other account displaying here is the Net Earnings or Net Income from the current year. This information is the “bottom line” from your P&L and will change each month based on the performance of the business that month. You want to monitor your equity trend. As this grows over time, it means what you own in the business is growing.
Graphical Reporting for Great Visuals
As part of our Progress Masters Program, we’ve developed new reporting for our clients to give them deeper insights into their financials. We use graphics to do trend analysis because a picture tells the story so much quicker, and in many cases, much clearer. What options do you have for visually monitoring your financials? If you find it challenging to review and digest the tabular data, then graphical reporting may be the answer for you. To learn more about Progress Masters, contact Bree@bookskeep.com. We start clients in the program every quarter and we’d love to add you to the waiting list.

Leave a Comment