
Our fourth and final blog of this series is a discussion of a new client service called SmartStatements. This service offers a visual look at financial statements using charts and graphs to make your statements a little easier to understand.
What If?
I hear from people all the time, “I’m not a numbers person, so even if I look at this report, it’s not going to make any sense to me.” This mantra of sorts has caused our team to ask, “What if?” What if our clients had an easy, visual way to understand their numbers rather than just numbers and columns on a page? SmartStatements is a way for us to graphically display your P&L and balance sheet so that you can easily see and understand what’s going on in your business without having to get so buried in the numbers. You can see what the current month looks like compared to the current quarter, compared to your year to date.
Let’s take a quick look at the three important components of this exciting new service!
Revenue Review
Here’s an example of the Revenue Review graph included in our SmartStatements:
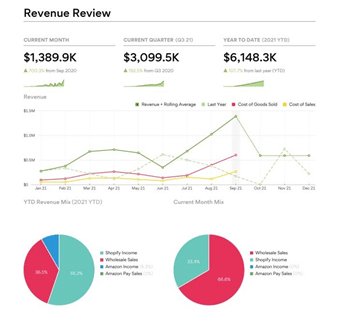
In this example, we can look at revenue and compare it over time to cost of goods sold (COGS) and cost of sales (COS) activity, like shipping. The green line is the actual revenue. The red one is COGS and the yellow one is COS. And we’re able to see all that as a rolling average over time. And then the dotted line is what last year looked like as an example. This example shows some Shopify income, some wholesale sales and some Amazon income.
Expenses Review
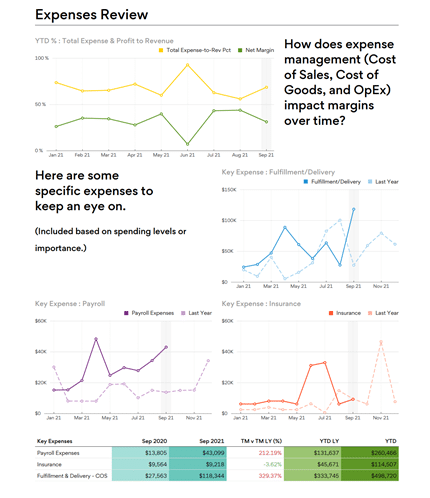
The graph below is an example of the Expenses Review in SmartStatements. You can see at a glance how your expense management (COS, COGS and OpEx) impacts your margins over time. You can compare your COS versus COGS. The Expenses Review graph also allows you to easily see things like your total expenses as a percentage of revenue, and you can compare that to your net margin. The visual you get in the graphic makes it easier to see the relationship between those two things. When those expenses get out of hand, your net margin plummets.
Another section of the Expenses Review graph gives you some examples of specific things to keep an eye on. You can look at your fulfillment/delivery costs, insurance, and payroll; things that are critical components of the state of your business. How do they look this year compared to last year?
Seeing these items laid out graphically can immediately tell you what you need to know, as opposed to feeling like you have to do a research project just to understand what’s happening.
Advertising Analysis
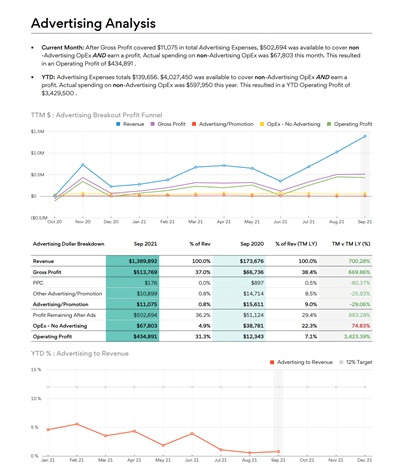
The third component of SmartStatements is the Advertising Analysis. With many of our clients, we sometimes see escalated expenses in advertising, but they don’t always mirror what’s going on with their revenue. The Advertising Analysis shows how the advertising expenses relate to the revenue, gross profit, expenses excluding advertising, and operating profit.
In the example below, the client has a pretty small advertising promotion budget. That’s not driving their boat, but I can tell you, I have seen this red line where we’re seeing advertising expenses going like up like a hockey stick and the revenue just kind of tailing along. And that’s an important piece of data that I think needs to be in your face, so to speak. You shouldn’t have to do a research project to figure it out.
At the beginning of the SmartStatements package, we include a metrics page or dashboard page that will draw conclusions from the data in the other graphs, such as what’s going on with revenue. As we put these together for our clients, if the information on the metrics page is good, we highlight it in green, and if there’s a problem, we highlight it in red. This allows our clients to glance through the red and green and quickly see how they’re doing, as opposed to having to dig through the P&L and balance sheet.
The metrics page will also show calculations such as gross and net margins and other indicators of business health, which are very important, as well. Watch the webinar here.
If you’re interested in learning more about SmartStatements and our other services, reach out to us and we’ll be in touch to schedule a chat!
Want to watch the complete Financial Statement webinar video? Click here.
Interested in Profit First?

You can also sign up for the Profit First for Ecommerce Sellers Online Course. As a Mastery Level, Certified Profit First Professional, I will teach you why Profit First works so well for ecommerce businesses and the particular challenges for businesses that have physical products requiring inventory management. You will learn how your behavior drives your money management habits for your business and how you can set up your business bank accounts to work with your habits.
Check out all our ecommerce accounting and profit advising services here!

Leave a Comment